My research agenda is related to governance and development in Mexico and Latin America
Map Gallery
Applying GIS technology to Mexican Development
Geographic Information Systems (GIS) are a great tool I have been using for several years in my work. I am particularly interested in applications to poverty relief and poverty mapping. In the last couple of years I have been working with historic cartography. Some of the maps in this gallery were produced many years ago with ArcView, most were done with ArcGIS, a couple with the open source QGIS software and some of the data was processed with GeoDA.
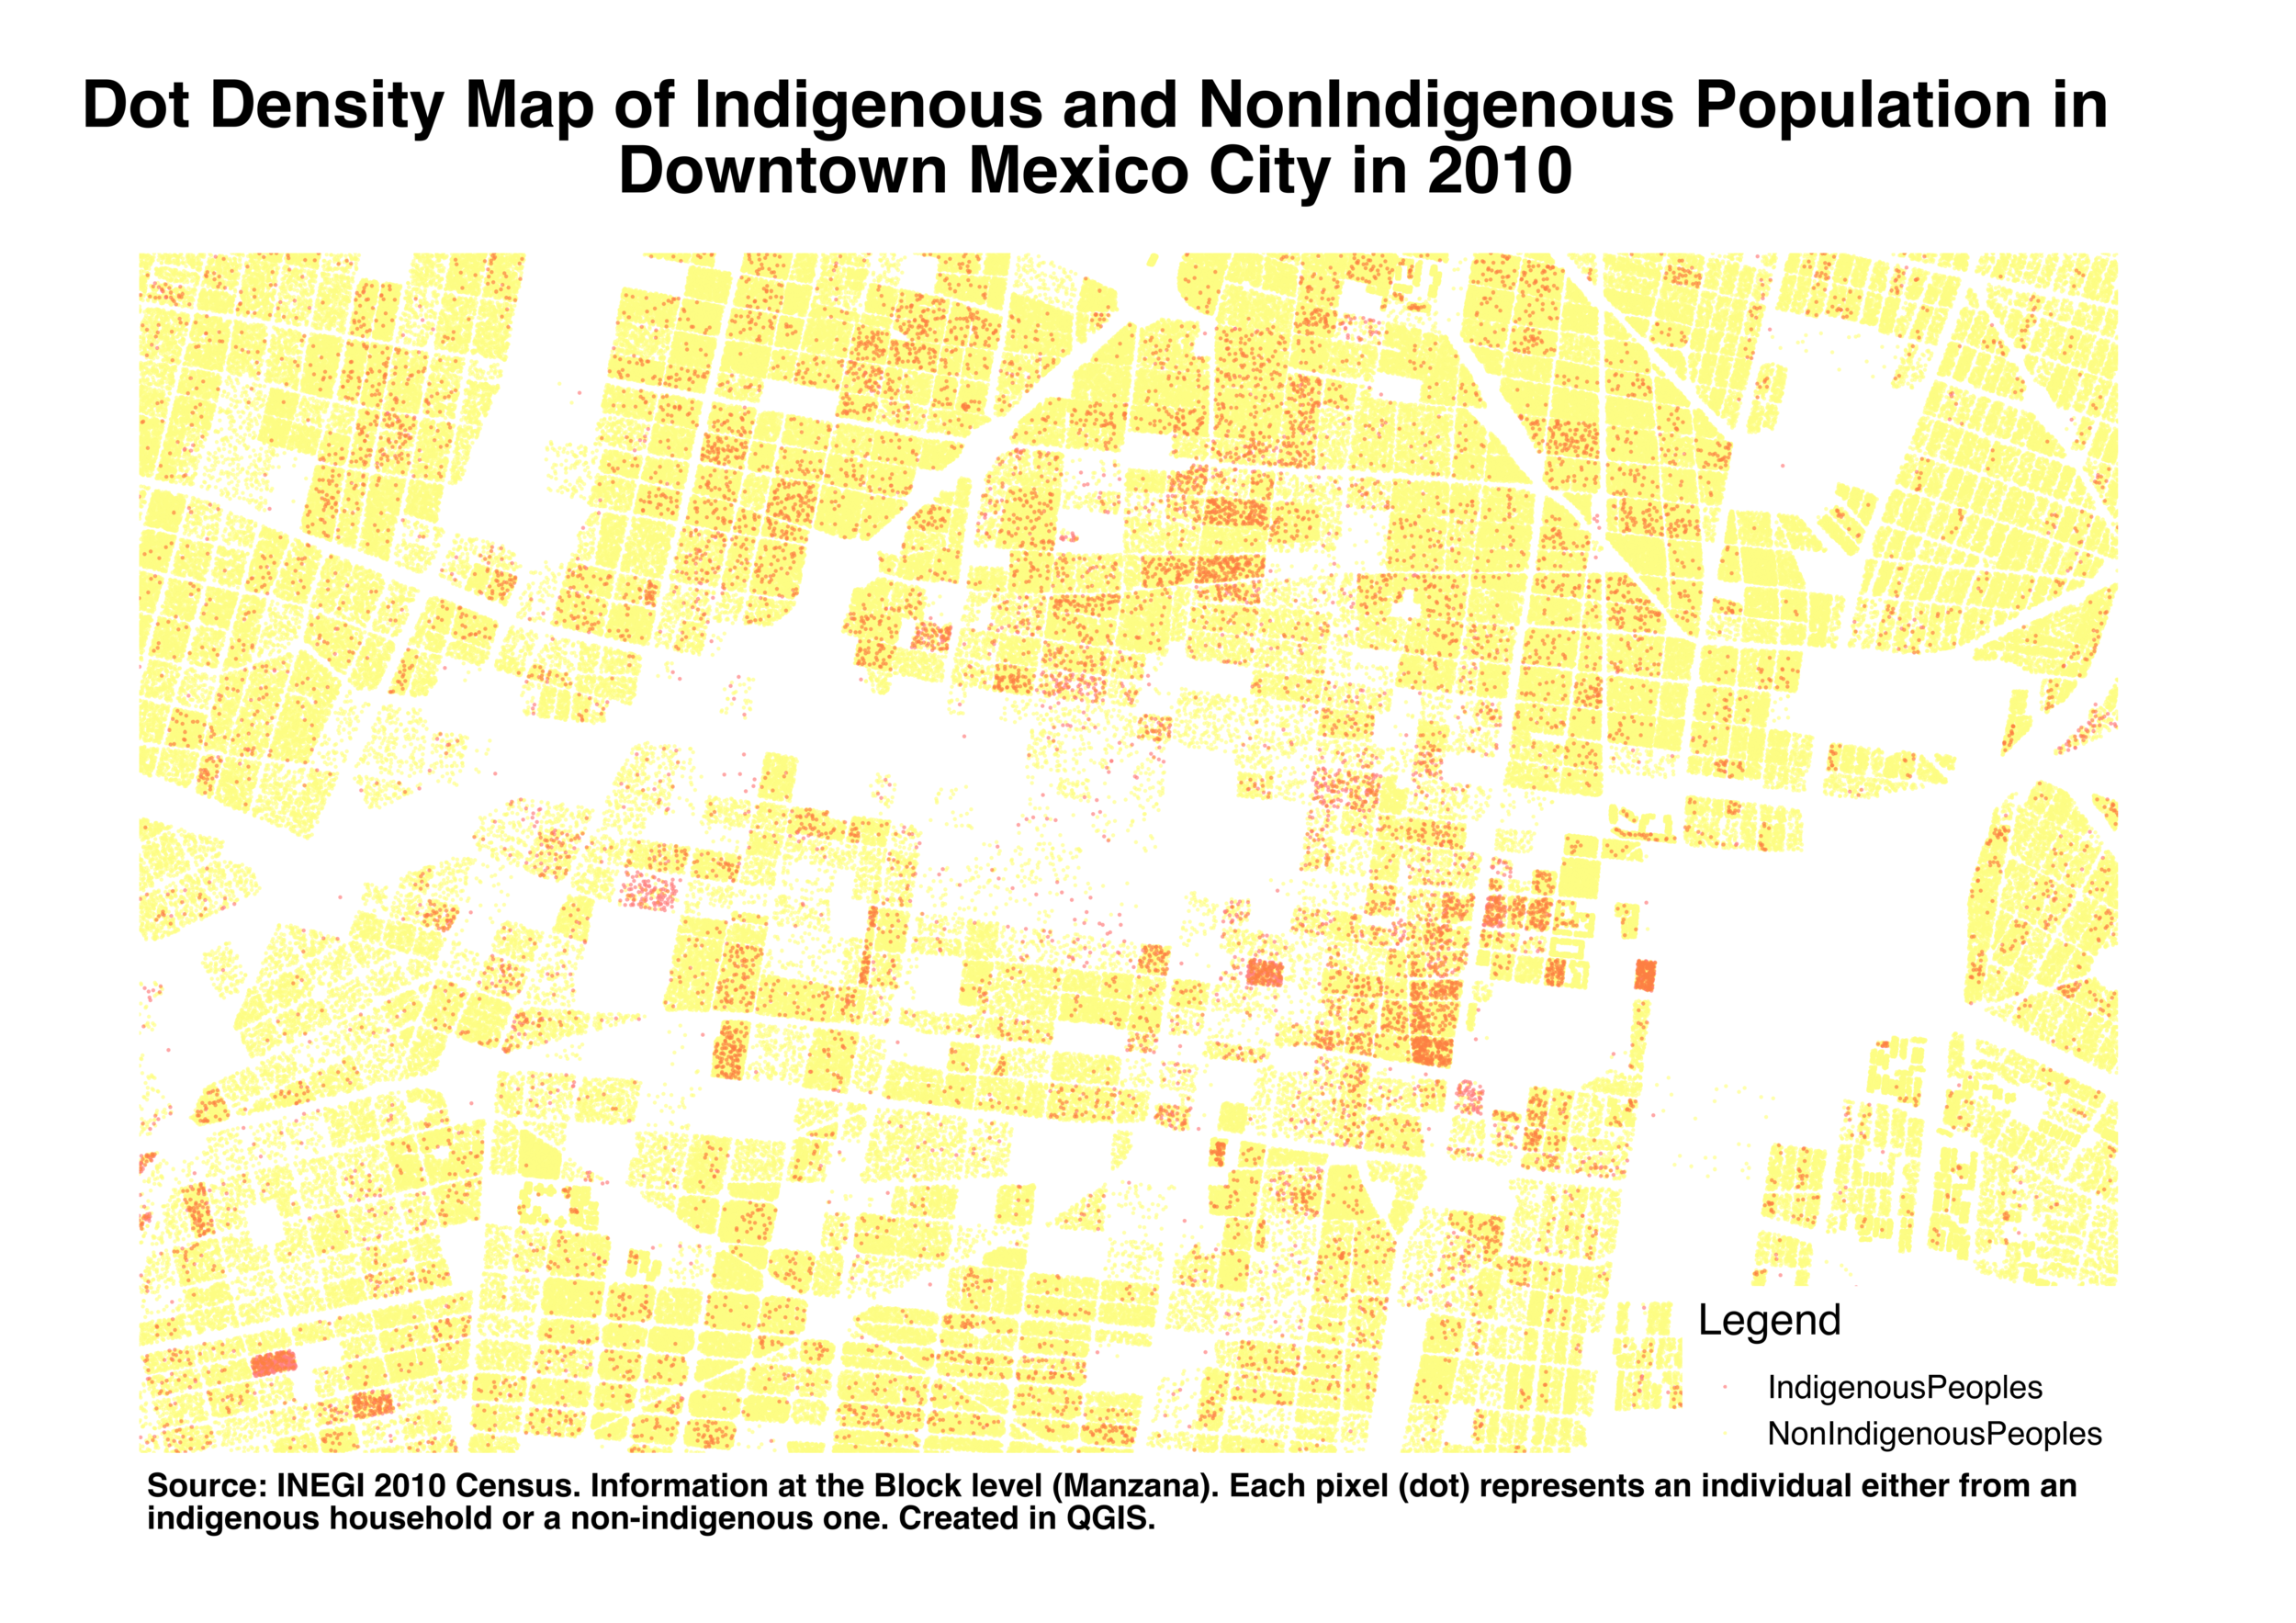
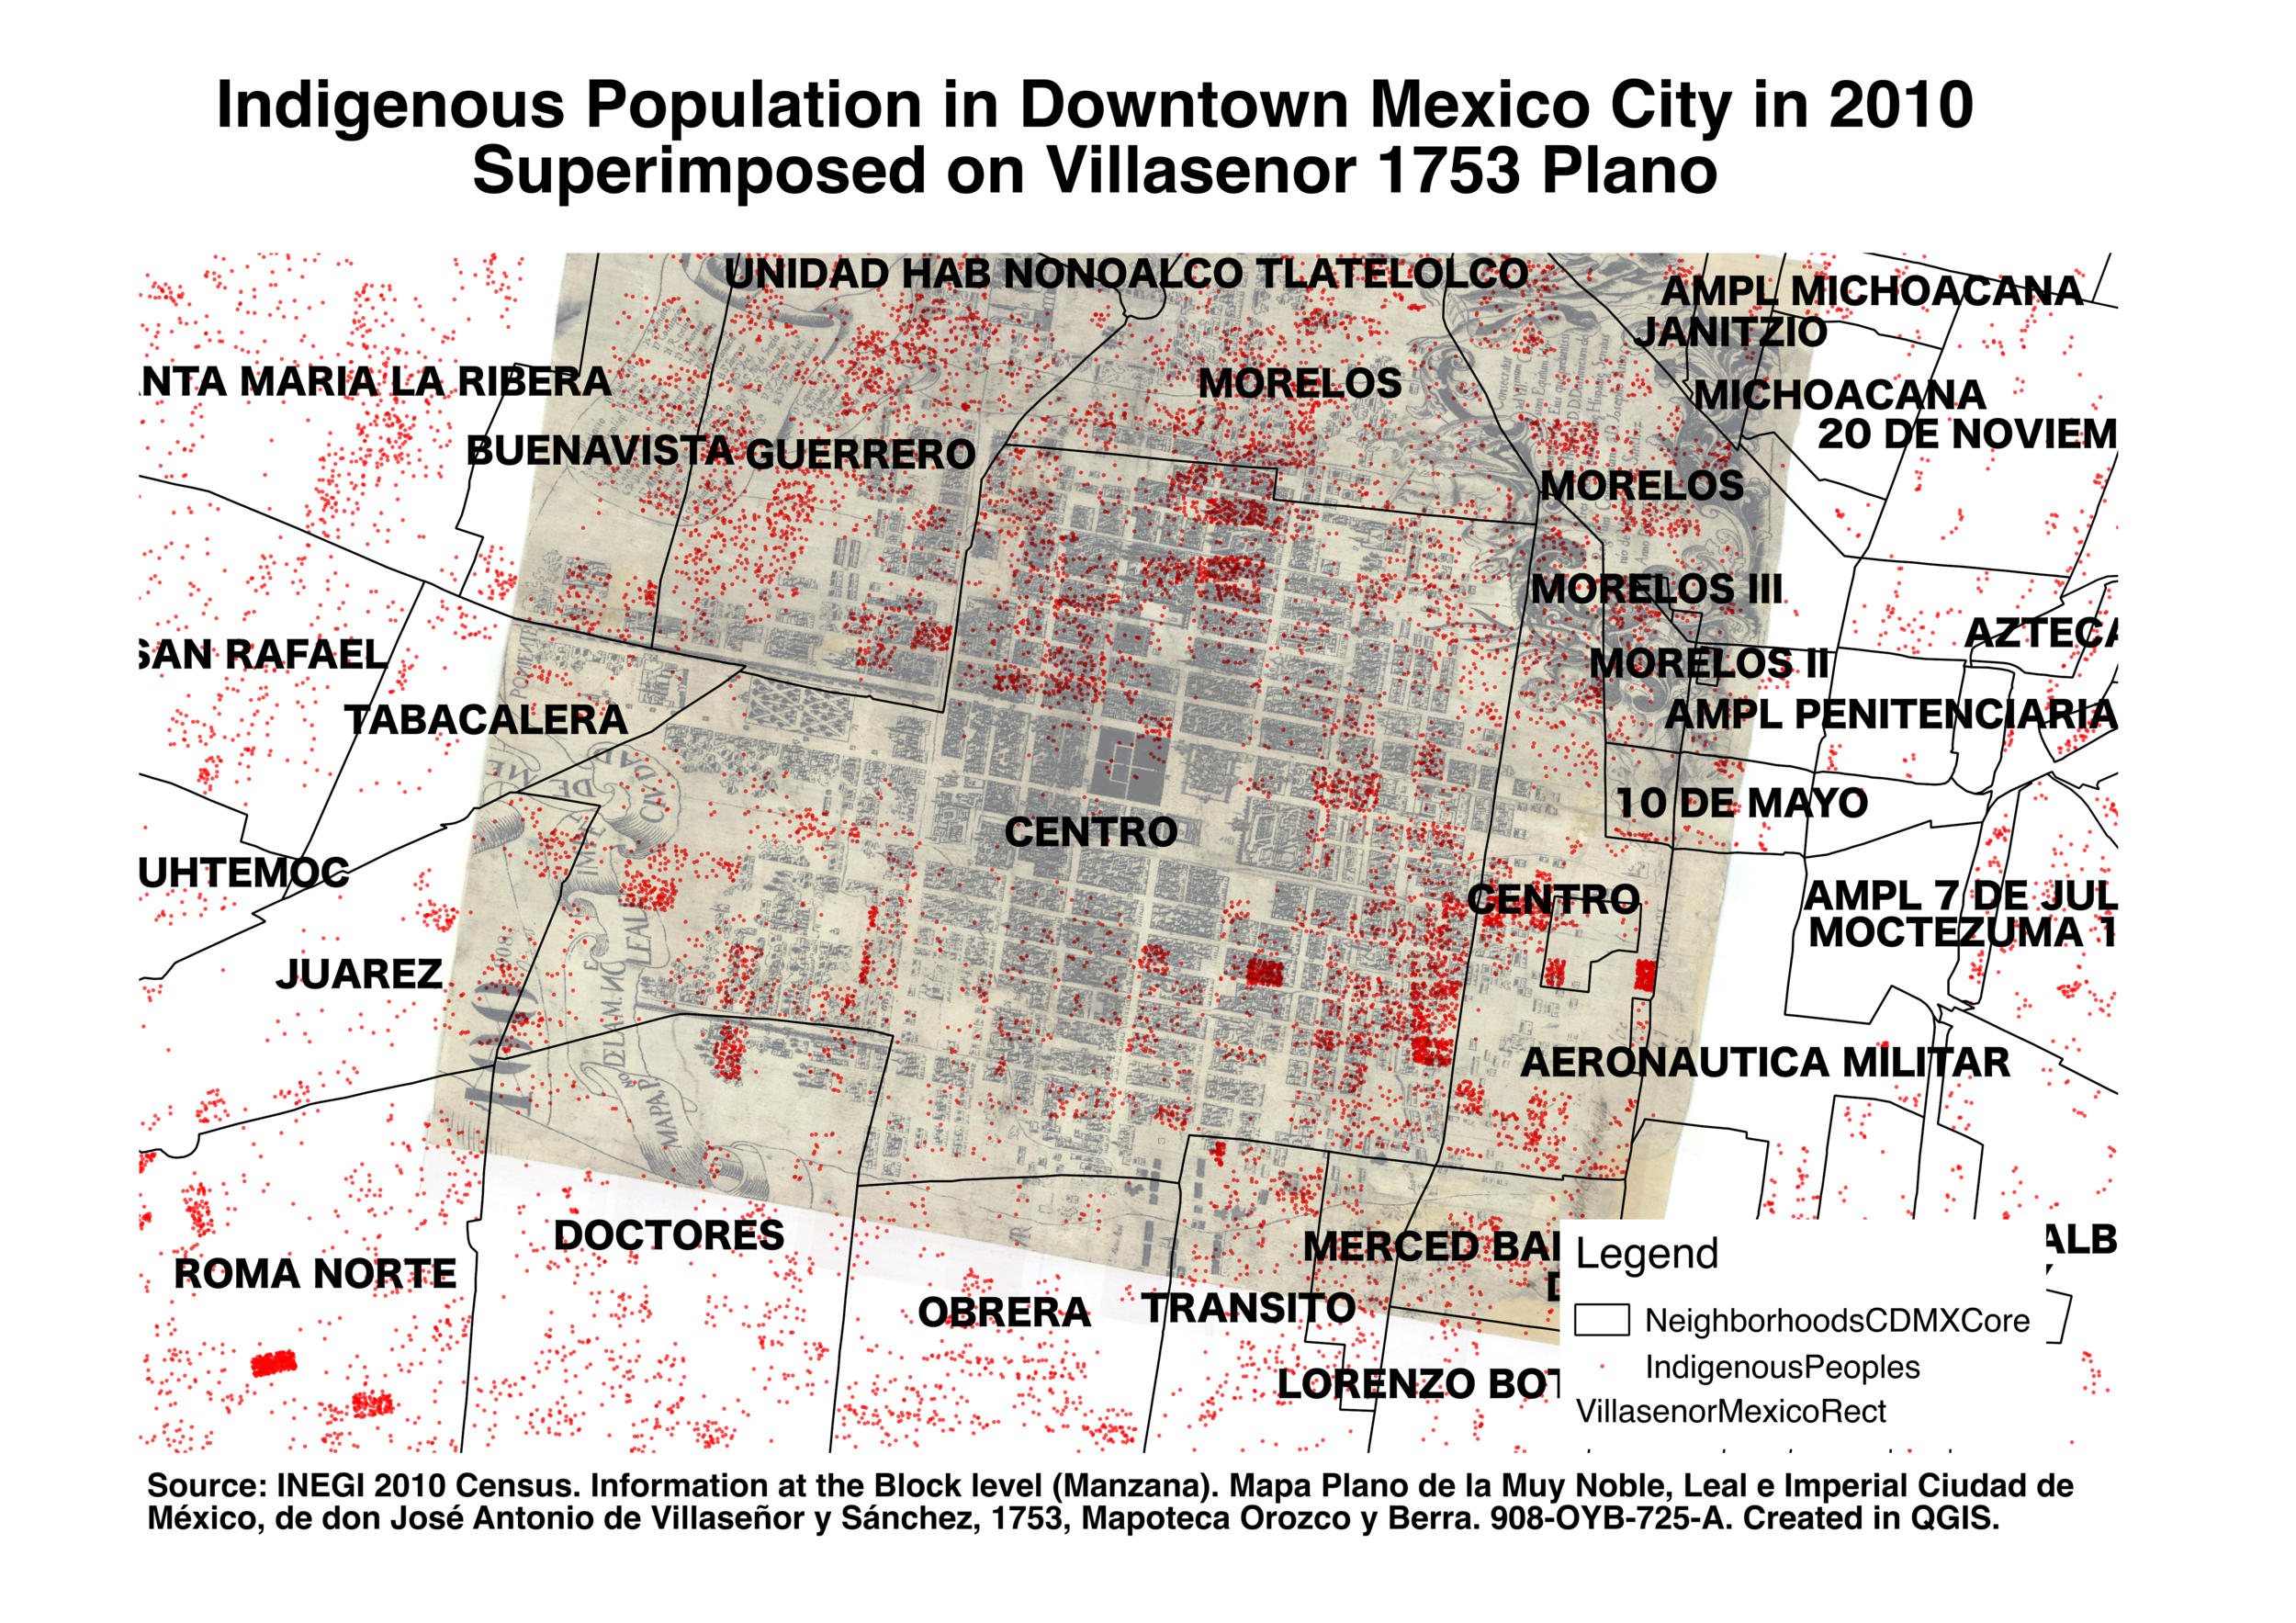
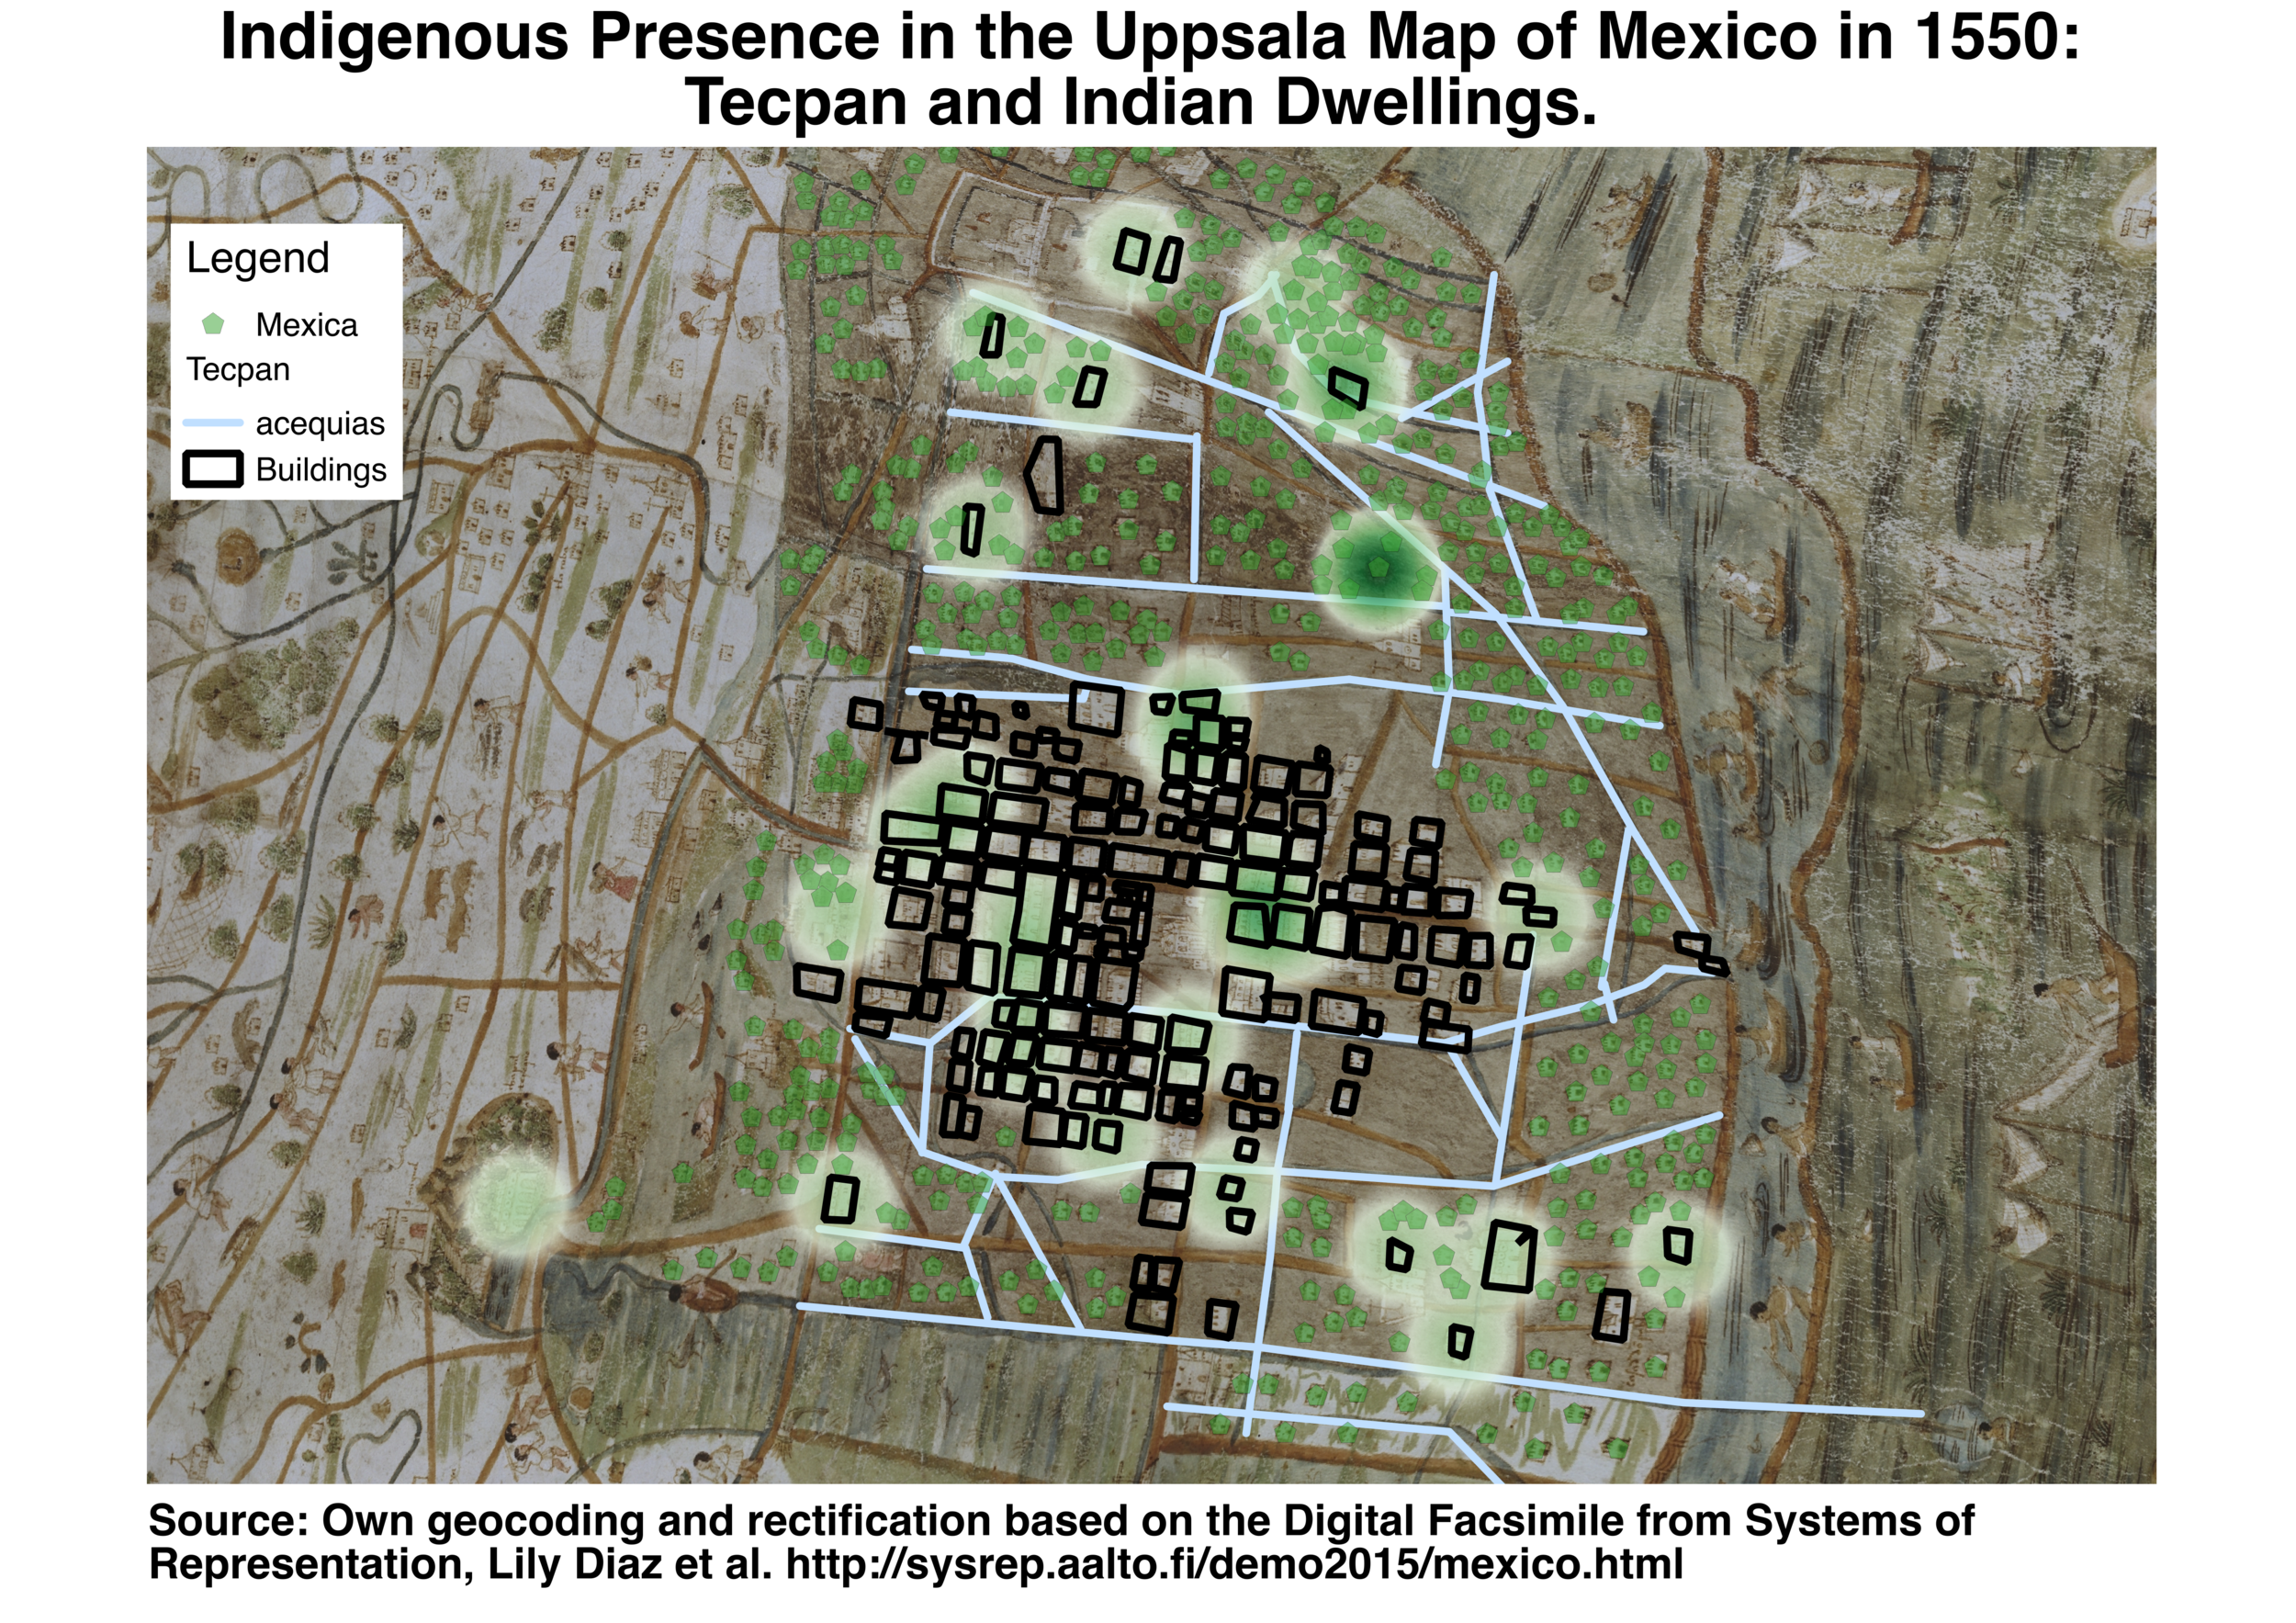
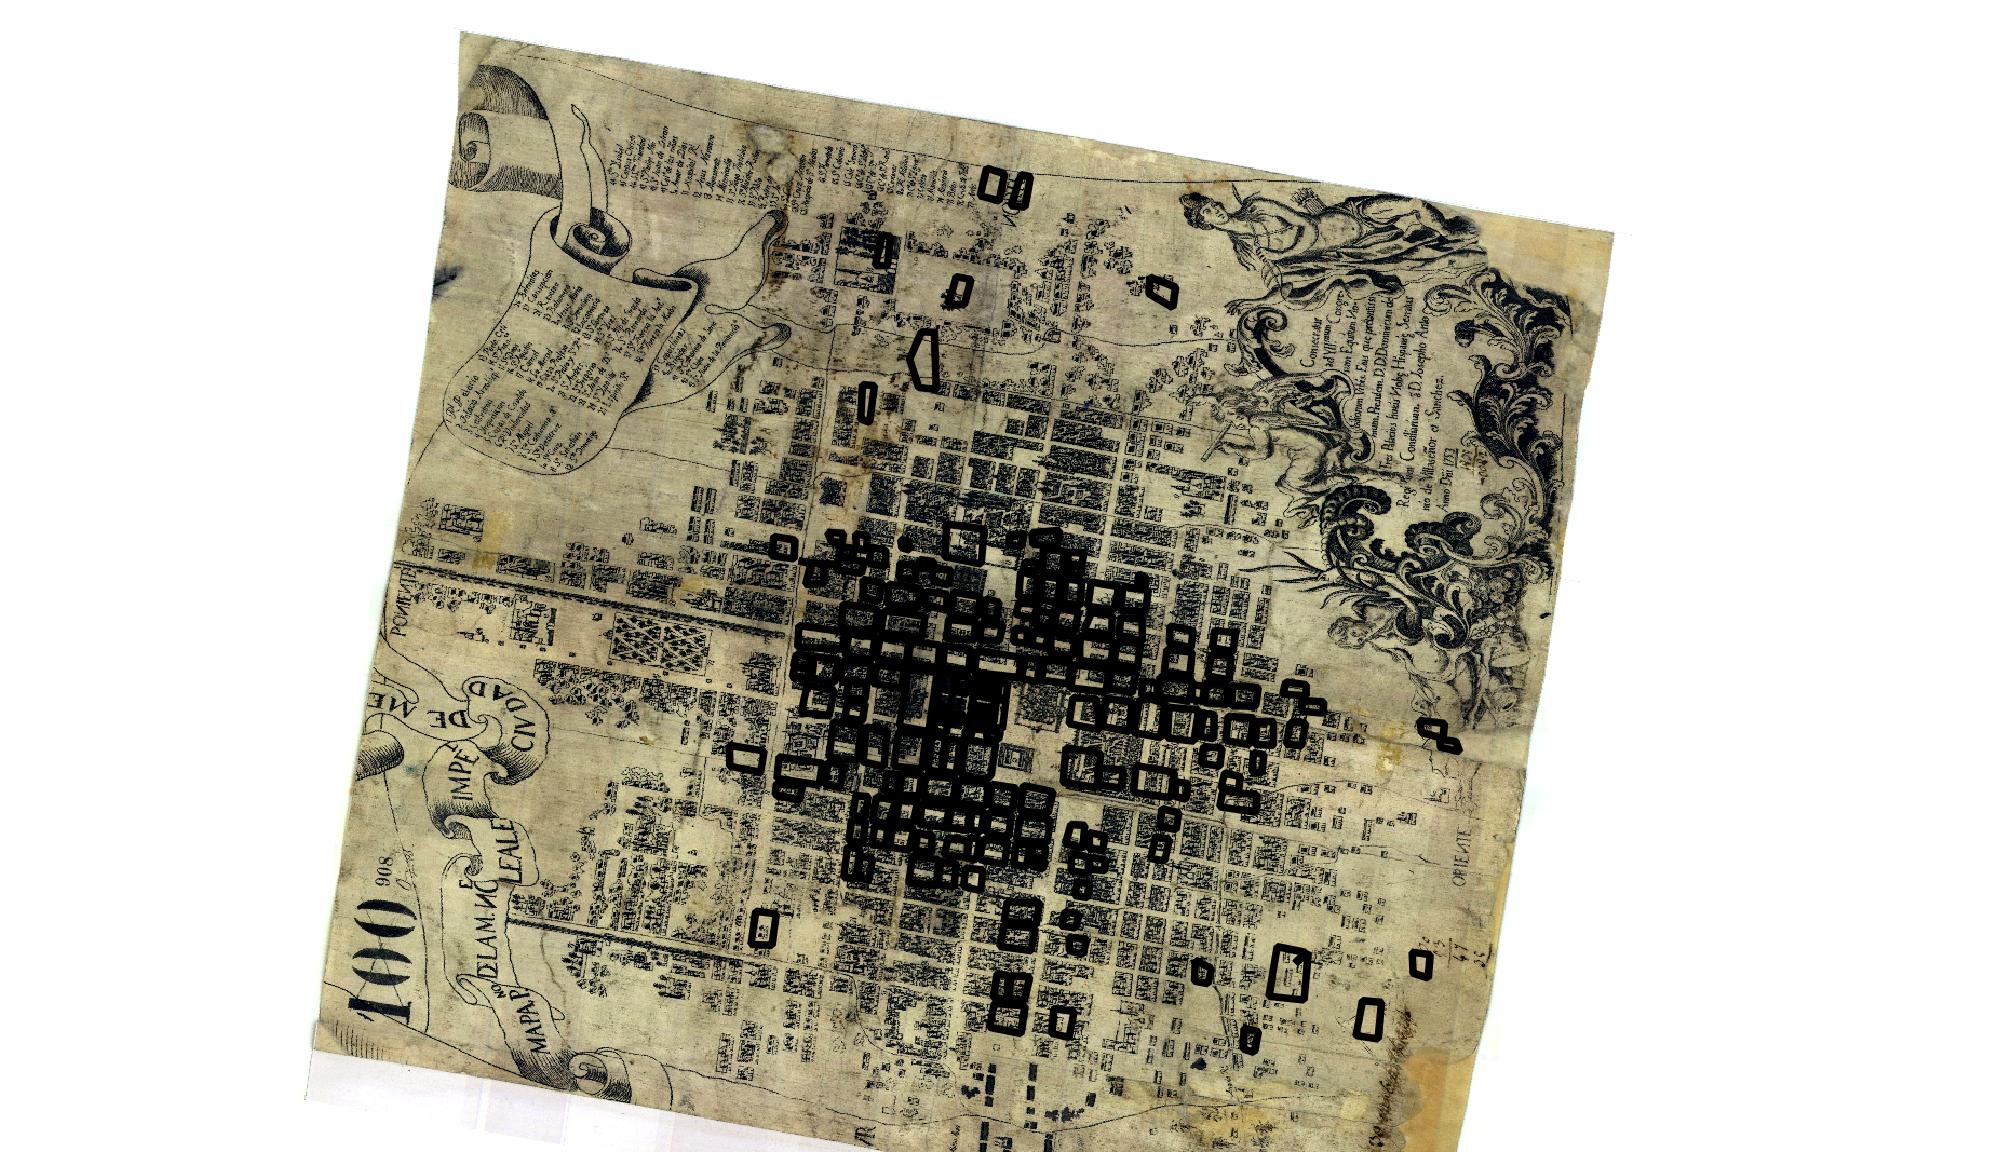
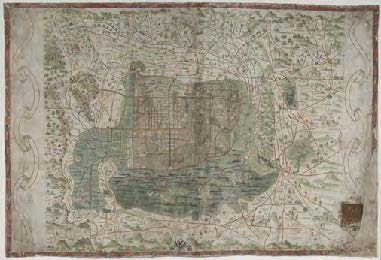
Indigenous Mexico City
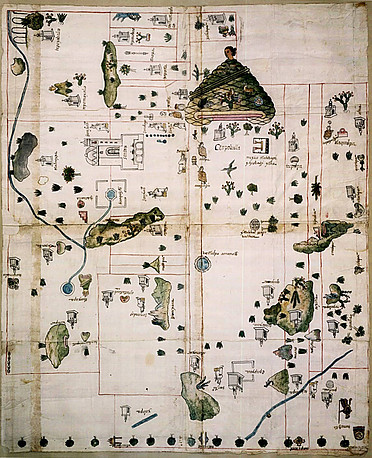
The past year I plunged in an exploration of the indigenous past of Mexico City. The work was prompted by the Map of Mexico in 1550, kept at the University of Uppsala, which is the first depiction of Tenochtitlan and Tlatelolco, and the surrounding lake and valley, after the conquest, drawn by indigenous hands. I have been working on the whispers of the indigenous past that can be still listened in Mexico City, seeking to uncover an indigenous city that still can be faintly heard today.

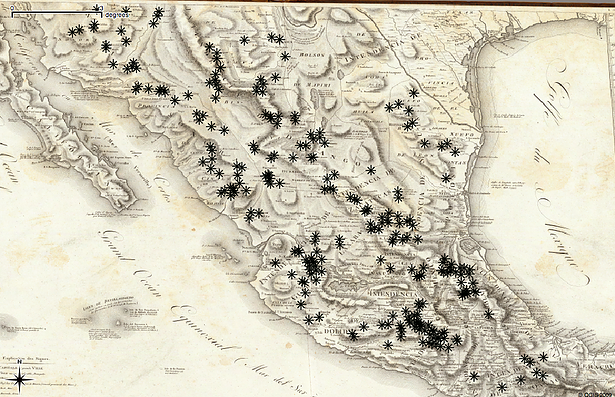
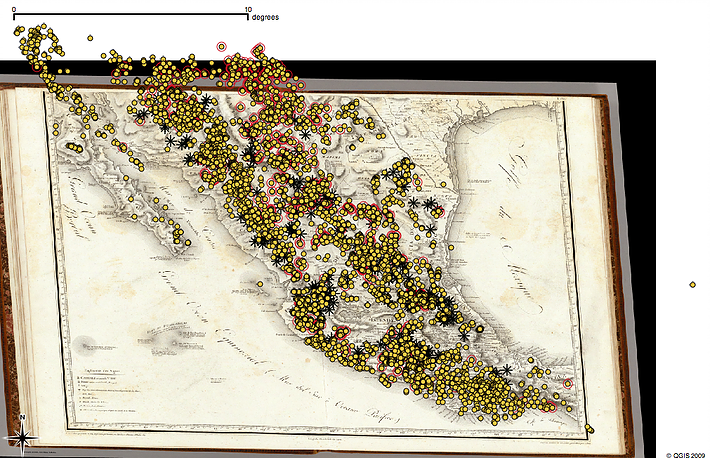
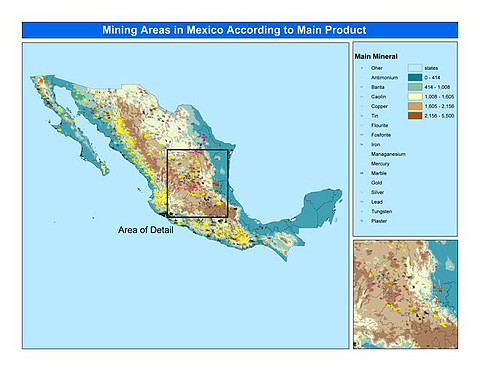
Humboldt's Maps
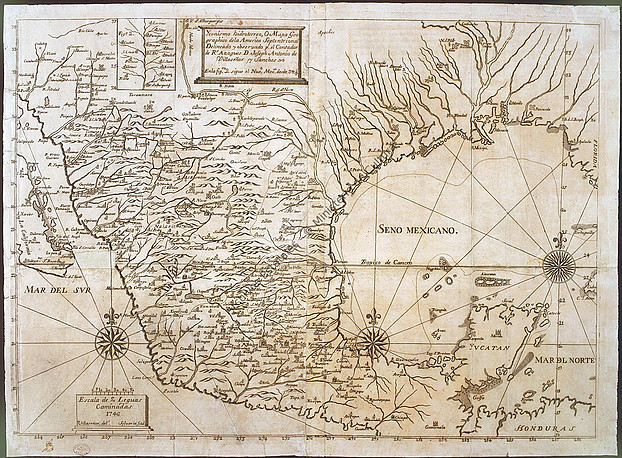
I have been fascinated by Alexander von Humboldt's Maps of Mexico for many years. I used one of his maps as the cover illustration for my book Federalism, Fiscal Authority and Centralization in Latin America. One of the best ways to appreciate these maps in their full beauty is the Rumsey Historical Map Collection. In the map that is shown to the left, one can see one of the most fascinating uses of GIS technologies. The map has been geo-referenced to a known projection, the mines Humboldt drew have been located in the territory, and then compared with the current mining locations. Finally, I have included all the mining sites in Mexico that I prepared for a project on commodity booms for the World Bank.
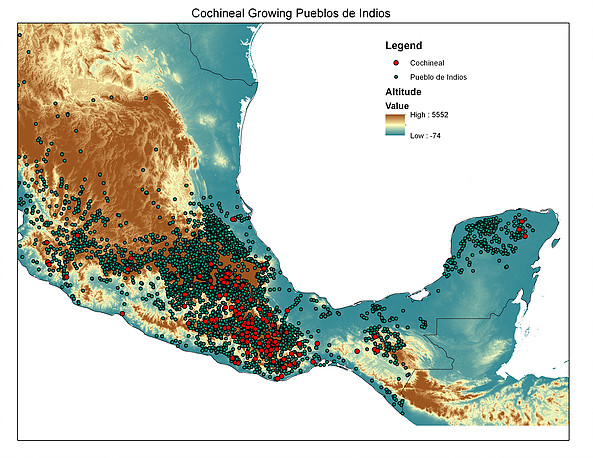
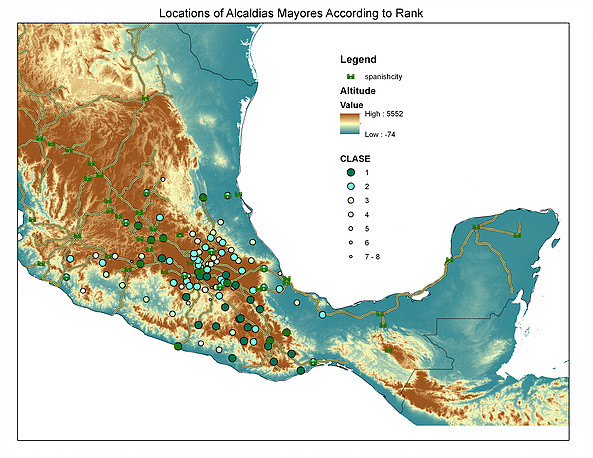
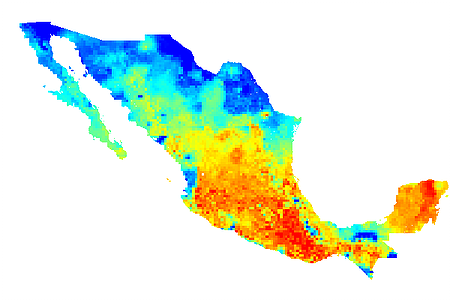
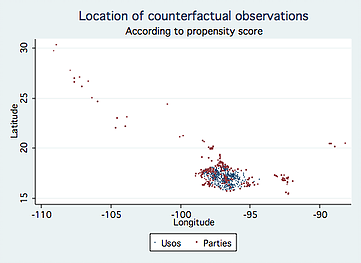
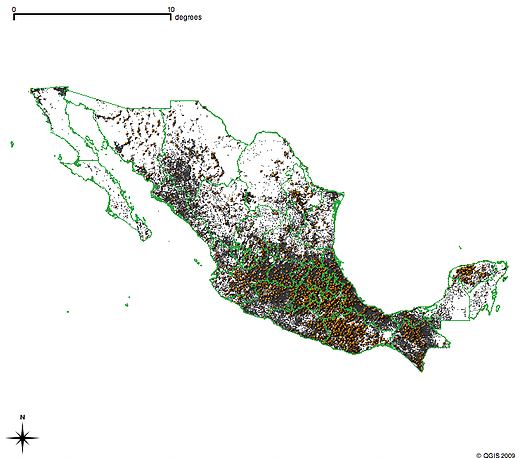
Impact on Cochineal Peoples
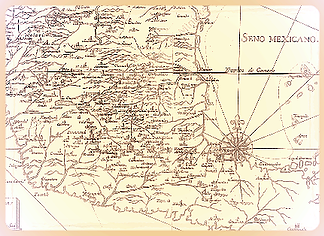
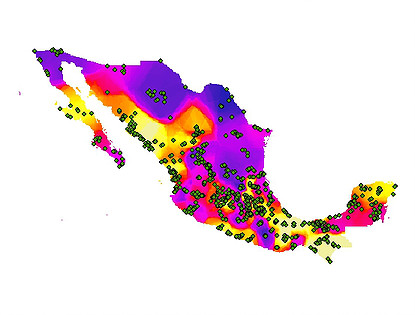
This series of maps shows some of the work I have pursued with Saumitra Jha at Stanford, seeking to understand the impact of cochineal growing on development in Southern Mexico. In the work we take advantage of the climatic fragility of this insect that constituted the second most important export of New Spain in world markets. We explore the relationship between cochineal growing communities and the Alcaldes Mayores, who embodied indirect rule during the colonial time. We have explored the limited expansion of Haciendas in cochineal growing regions as well as the impact in contemporary development indicators. A final map shows a bioclimatic envelope calculation of the growing region appropriate for dactylopius coccus (cochineal) using the OpenModeller software.
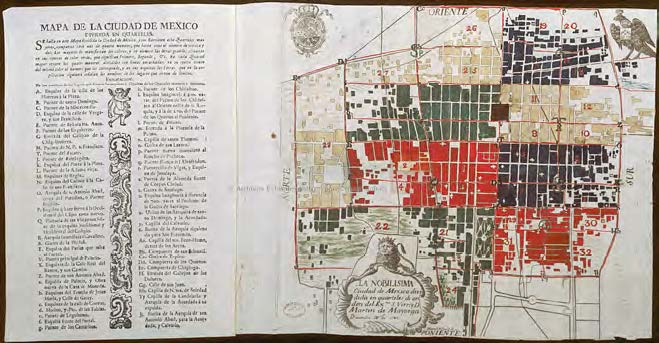
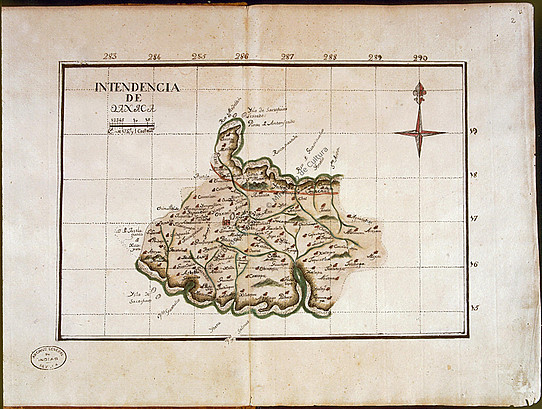
Colonial Cartography
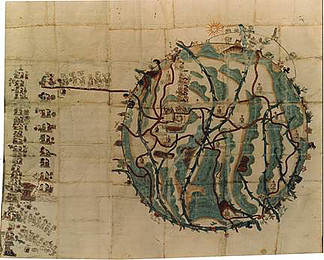
The beauty of cartography during the colonial era in Mexico is hard to describe. The indigenous artists who drew or mapped their local topographies for theRelaciones Geograficas, or the Cosmographers and Geographers who tried to understand (and control) the colonial territory through mapping the indigenous human settlements and the natural environment had very differentperspectives and purposes. But we can learn much from combining modern GIS technologies with the narratives and descriptions we have inherited from the past. I know of no better effort at this type of reconstruction than the Lienzo de Quauhquechollan mapdepicting the history of the conquest of Guatemala.

Some other interesting maps
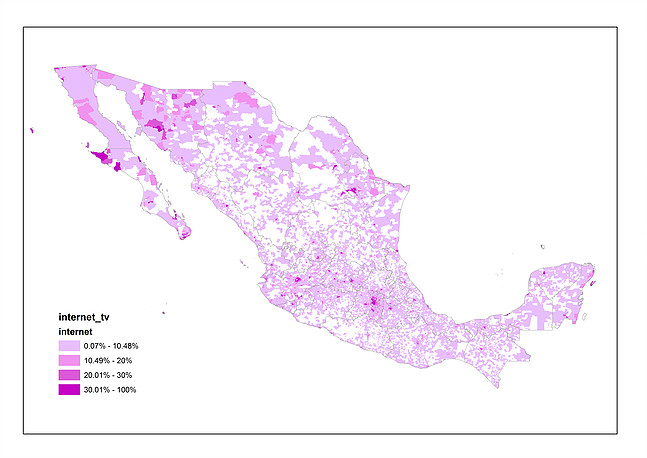
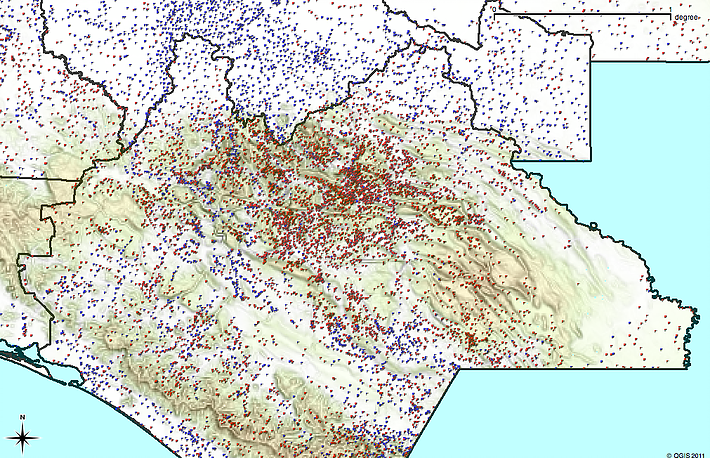
These are various maps that have been useful in different projects. The distance to railroad lines provides a useful instrument for the trade connectivity of the country since the 19th century; current connectivity is summarized by internet access at the electoral precinct level; localities in Chiapas and the Tehuacan - Cuicatlan basin can be depicted according to their poverty index within their topographic space. I have also geocoded and interpolated diarrhea prevalence rates according to the ENSA 2000 health survey; and a final application to colonial Mexico is the coding of the farming areas according to the landmark study by the late Francois Chevalier.

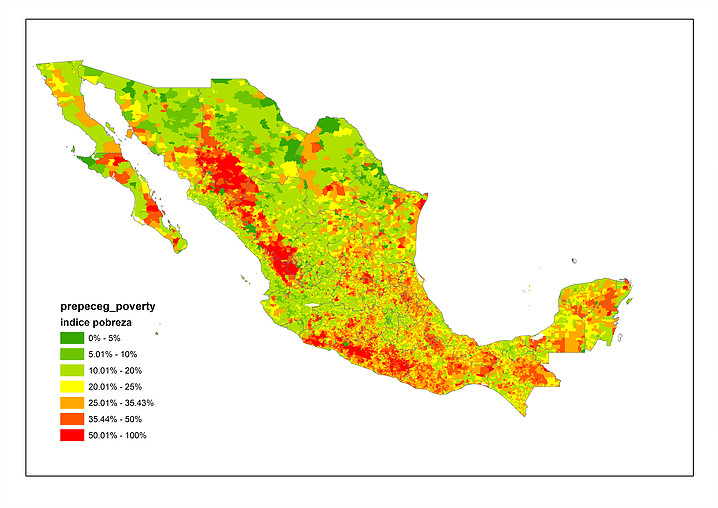
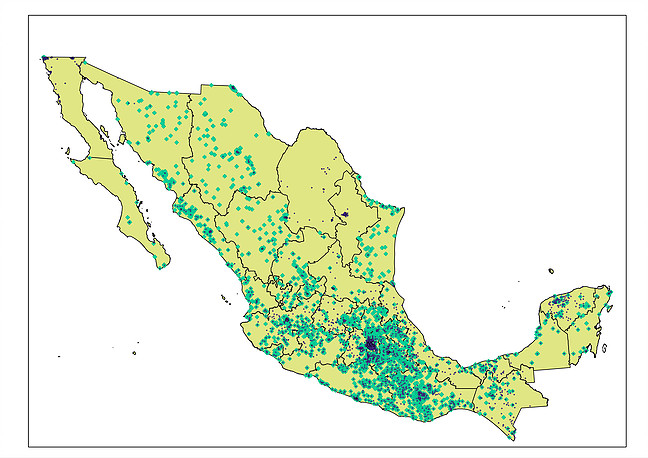
Poverty Mapping
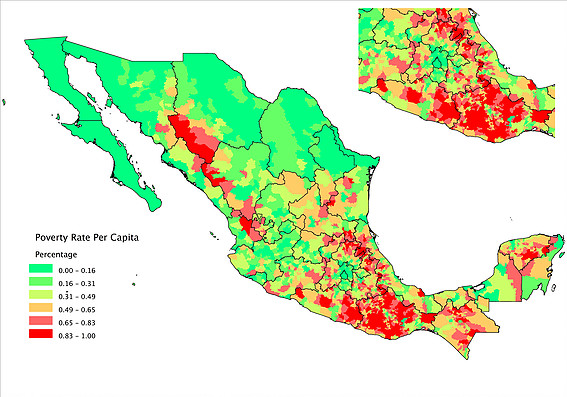
I started using Geographic Information Systems in order to display poverty in a spatial context. Municipal level poverty maps (n~=2,400) have been generally available for Mexico, where an important effort has been to produce an official Nutritional Poverty Headcount Index (extreme poverty) through CONEVAL. We used such mapping for our Book Buying Votes for the Poor. But in recent years I have become convinced it is not enough to map at the level of the local political jurisdiction, since regional inequality within municipalities is just as important for the provision of public services. The second map provides a poverty index calculated on the basis of Census Indicators at the Electoral Precinct level (n ~=65,000).
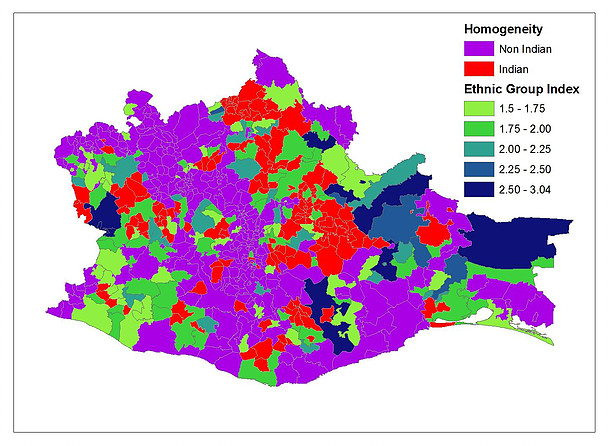
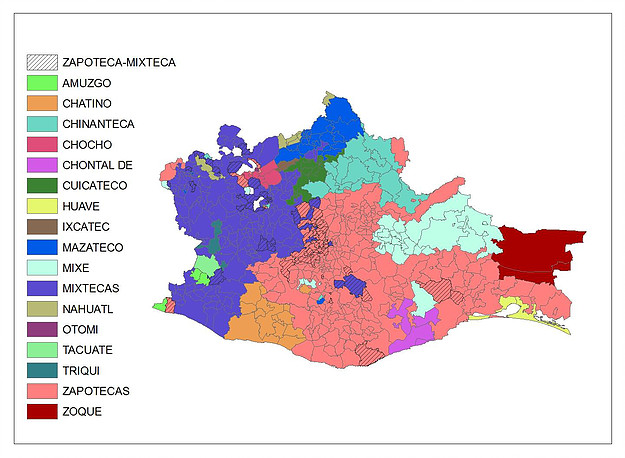
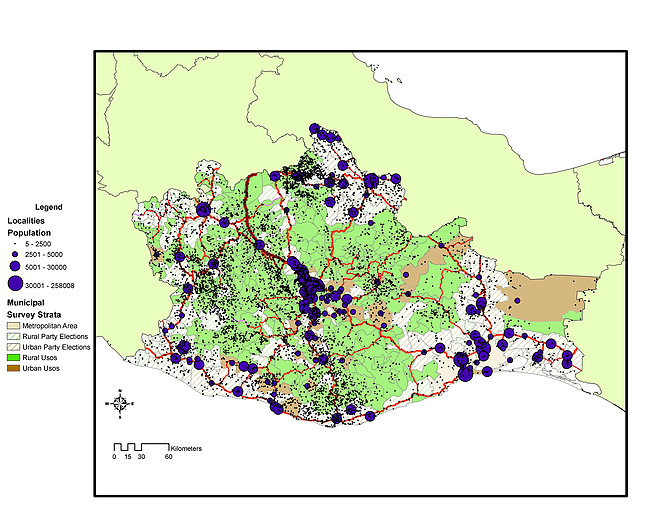
Governance in Oaxaca
I am seeking to understand the forms of traditional governance in the state of Oaxaca. This is one of the most diverse places in the country, with a vibrant sense of community life and civic engagement. The provision of public goods that directly impact the quality of life and wellbeing of Mexican citizens are primarily the responsibility of municipal governments. Public safety, drinking water, sewerage and electricity, as well as facilities such as marketplaces, parks, graveyards, slaughterhouses and other urban amenities are provided by mayors with funds they receive from other levels of government, mostly the federal one.
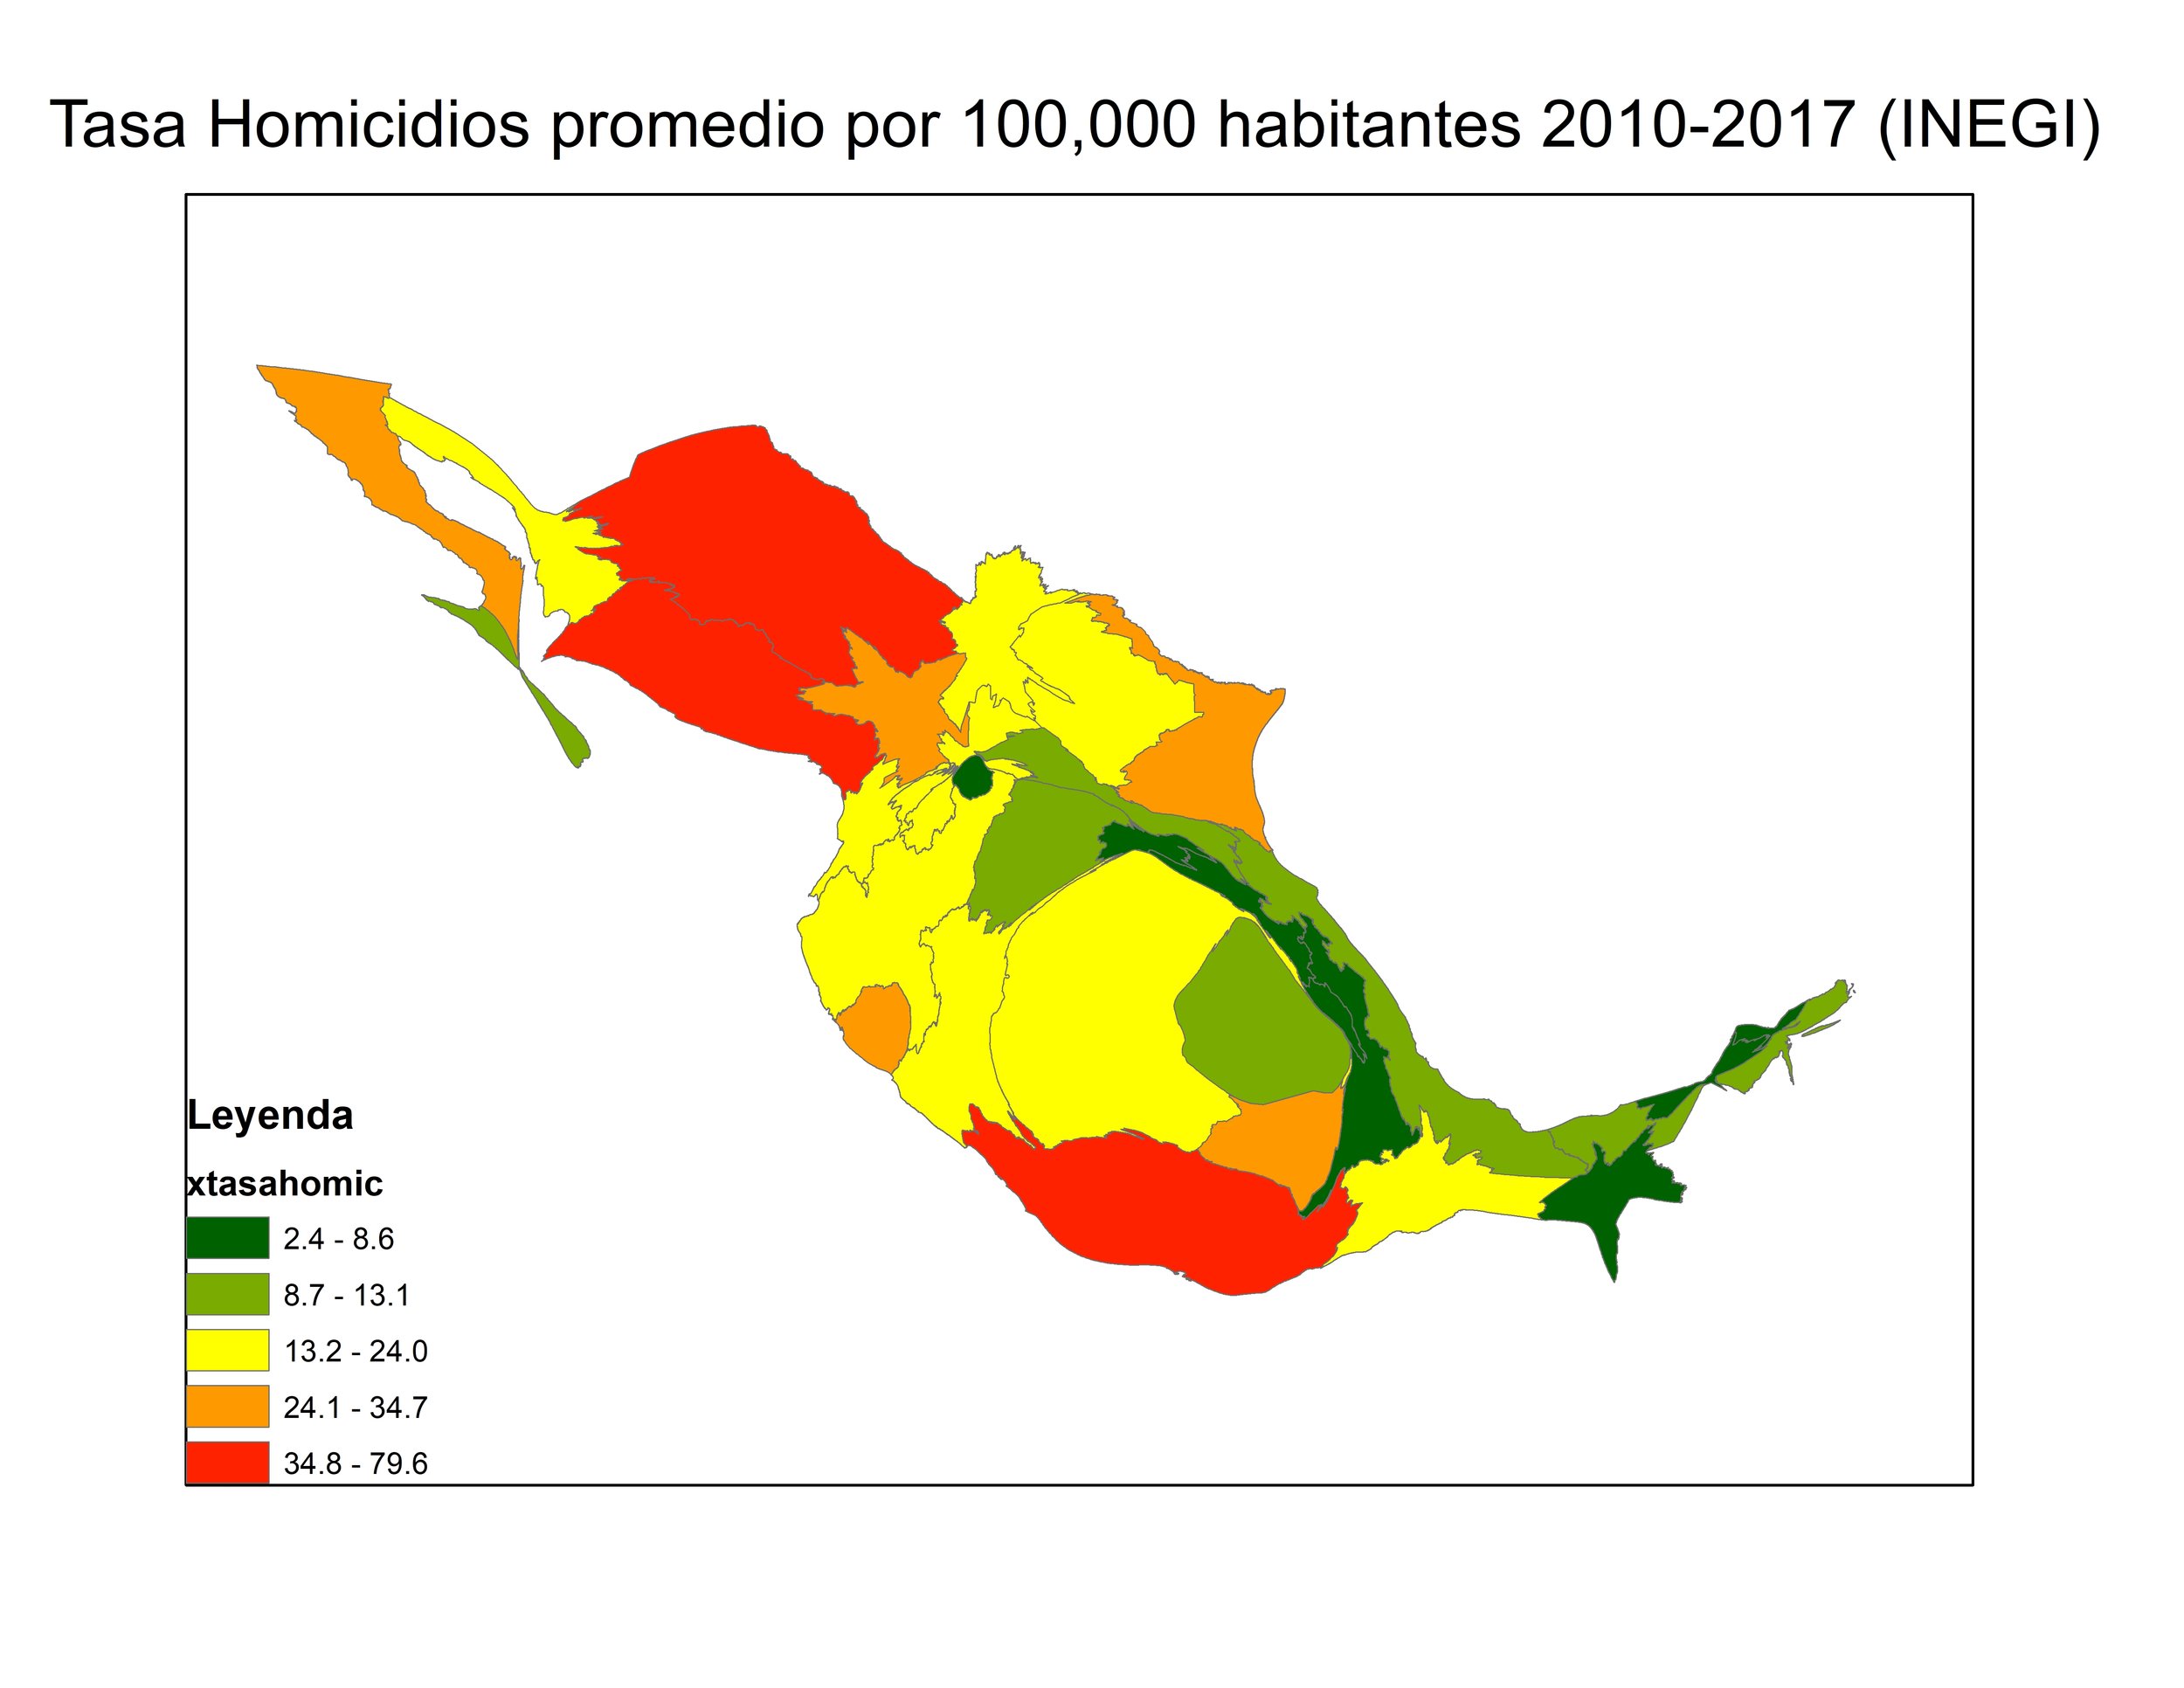
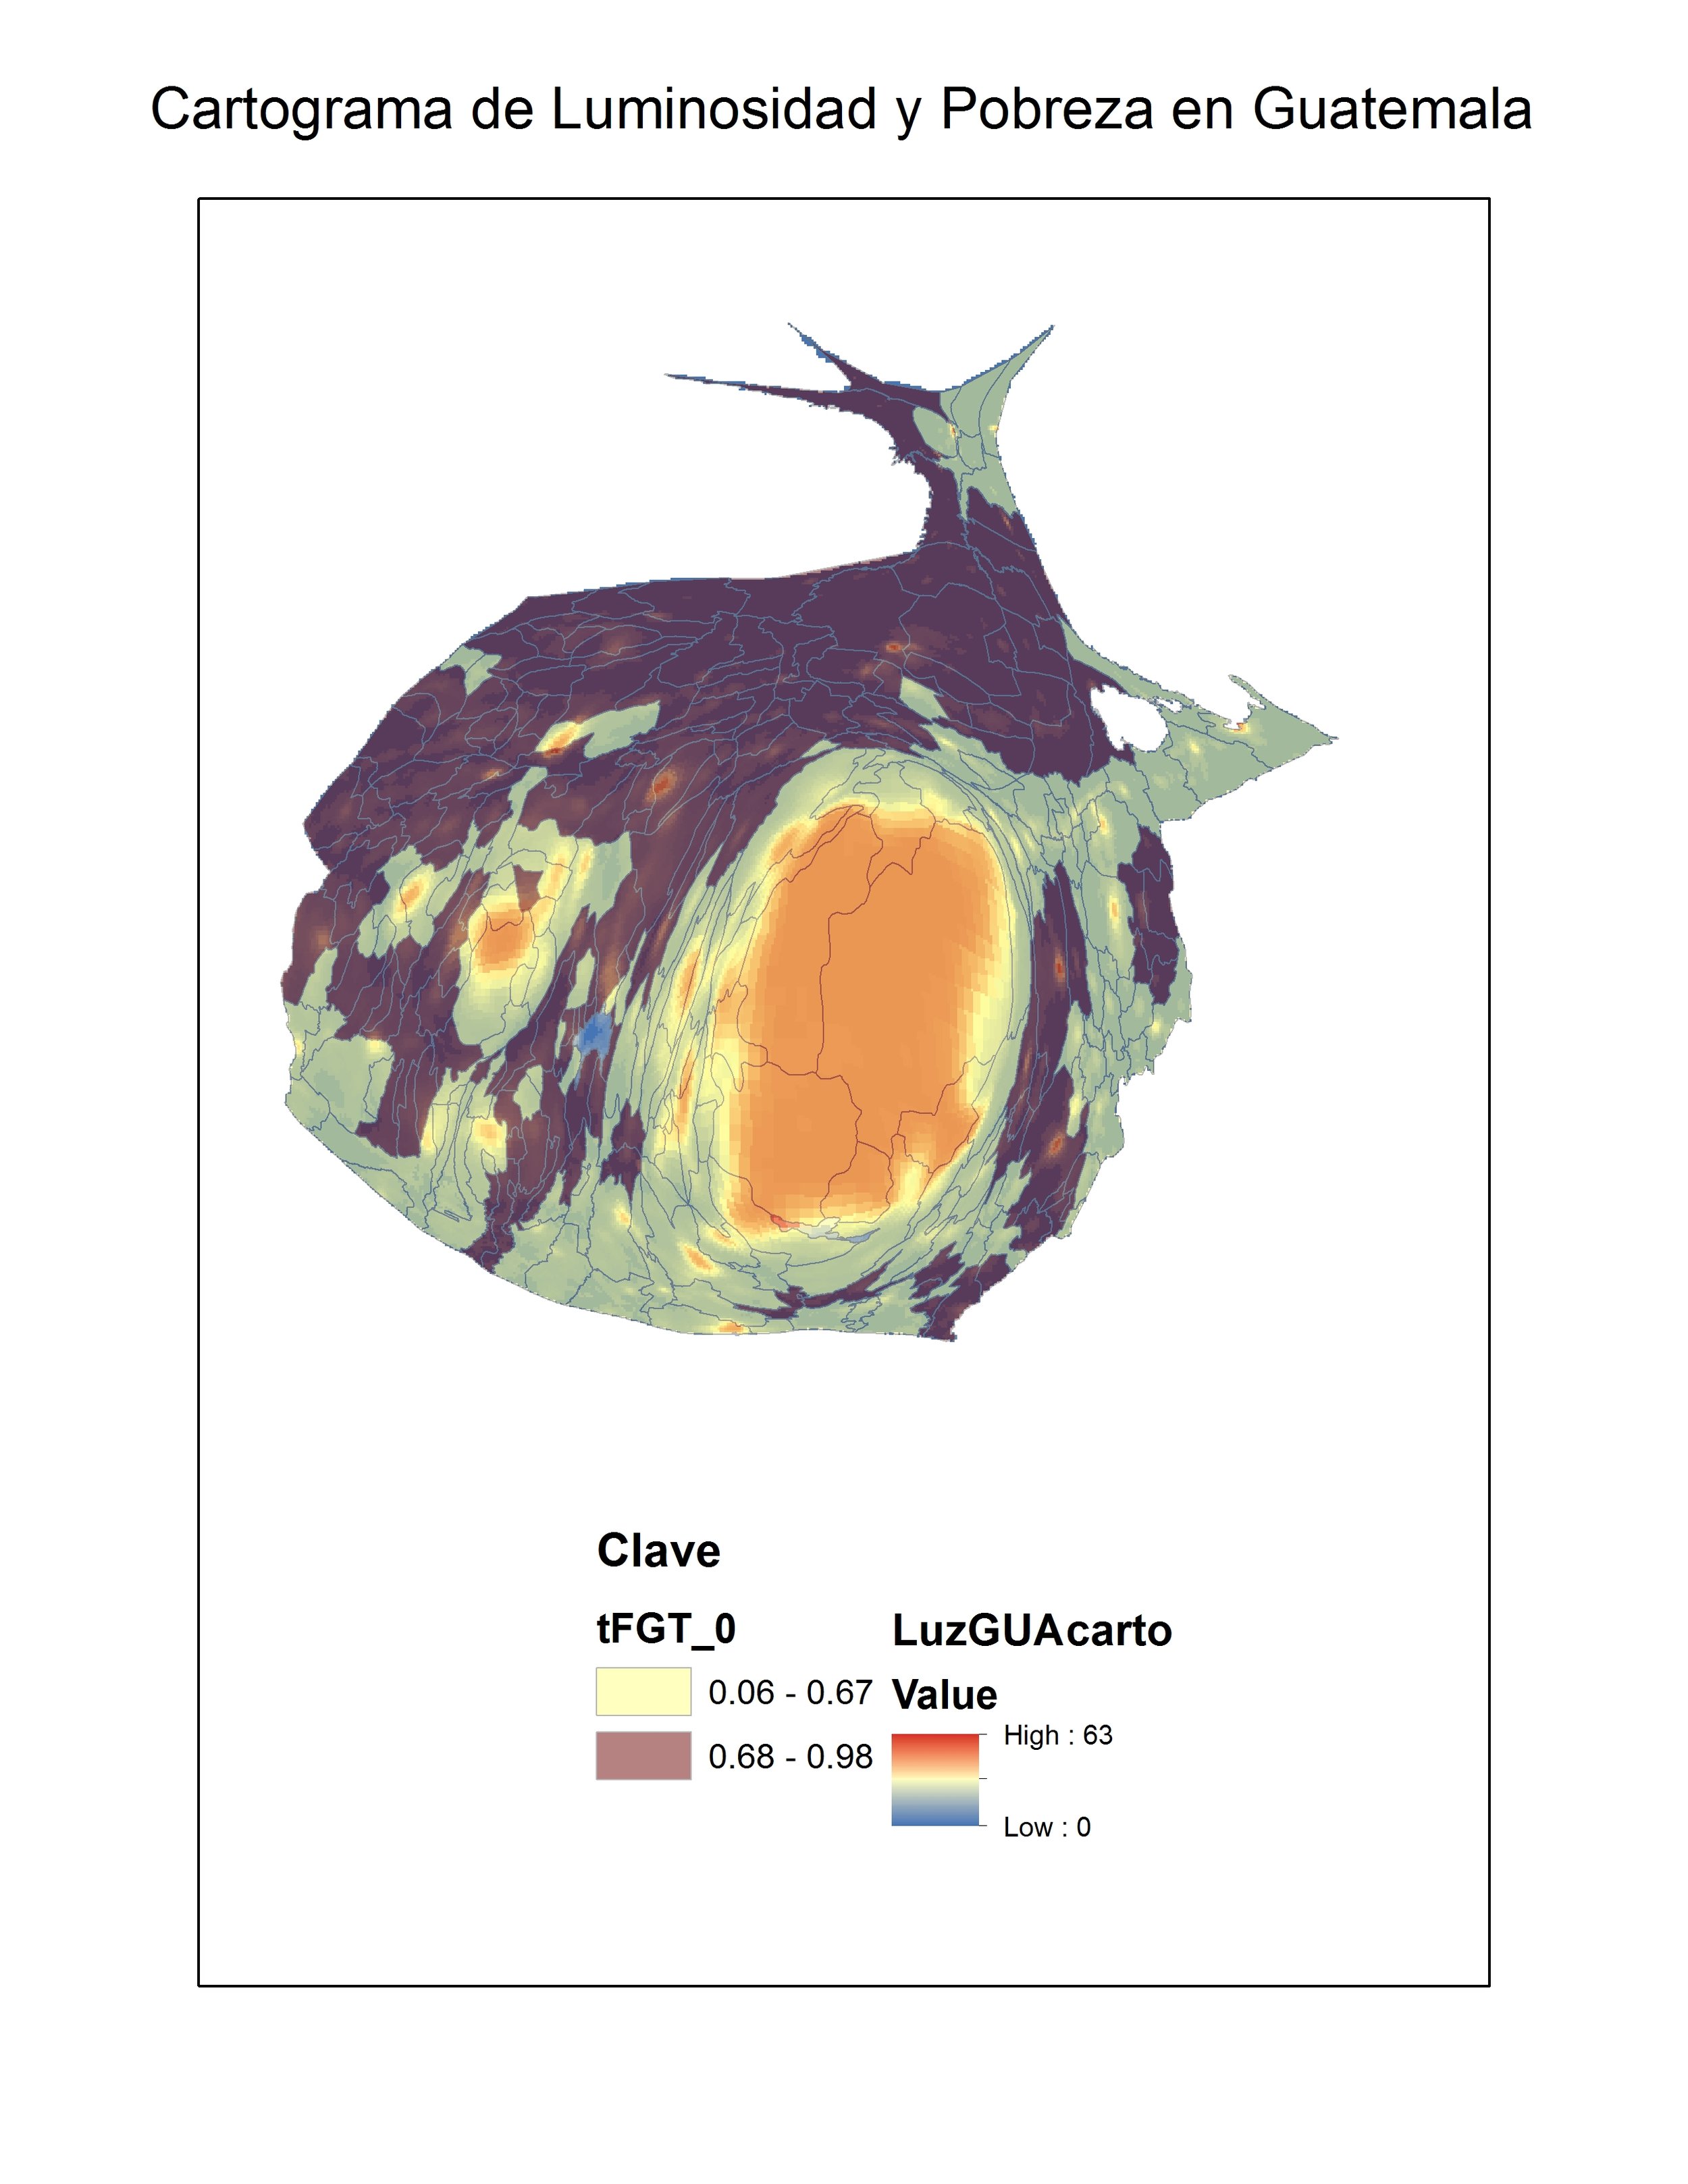
Cartograms
Over the years I have had to experiment with the display of information in maps, opting to show some data in so called Cartograms, maps that are proportional not to the territory, but to the social phenomenon that is highlighted by the map. This series of maps shows various exercises with cartograms mostly related to violence in the world and in Mexico.

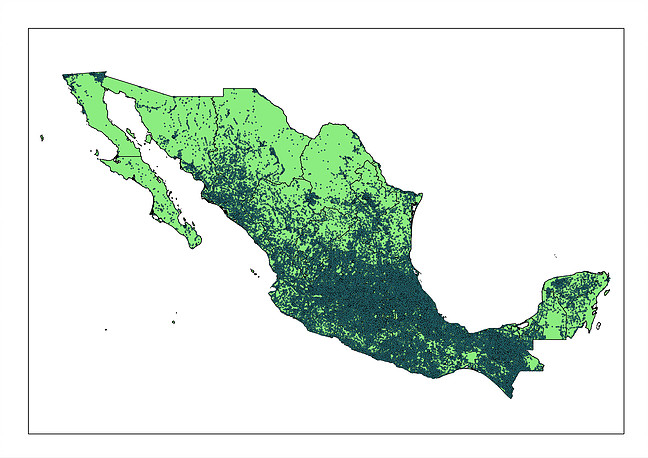
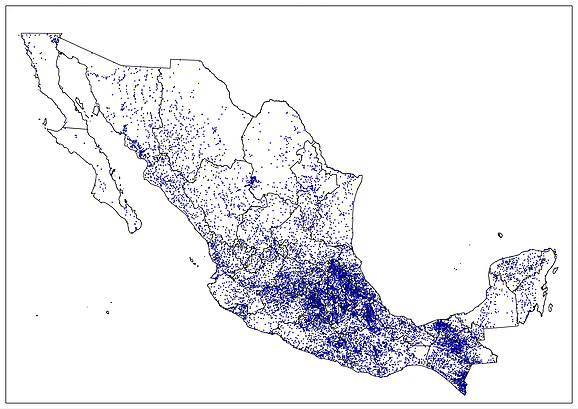
State Infrastructure
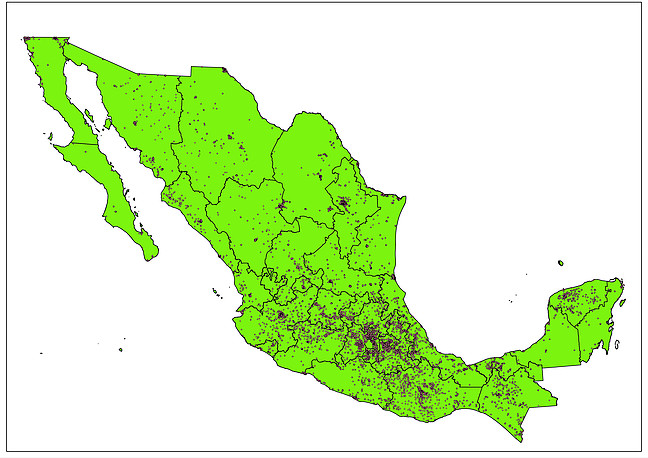
Some scholars have argued that the Mexican state is "weak" when confronting the challenge of violence and Drug Traffic Organizations (DTOs). The series of maps takes a look at the capacity of the Mexican state to broadcast power, as reflected in the provision of public goods even in some of the most remote localities. The first map shows the distribution of around 130,000 localities with more than 2 homes, and locates the cabeceras of the municipalities, the seats of political power. Those centers of power can then be compared to the provision of water tanks, public markets, schools and health clinics. The reach of the Mexican state covers the whole territory. The only institutions with a similar reach (and much limited in comparison) are the churches, also displayed in the last map.
Useful Links
INEGI, the Mexican Statistical Office, is a major source of GIS layers
For a geospatial mapping of poverty in Mexico see the CIMMYT website.
For really interesting maps of disaster risk in Mexico see CENAPRED's atlas.
The CIAT Centro Internacional de Agricultura Tropical has developedgeodata of population density for Latin America.
For information on biodiversity in Mexico an excellent Atlas is provided by CONABIO. This open source application also includes climatology and sociodemographic data.
A very good WMS server of Mexico data is available at AntropoSIG in CIESAS.